 Continuing Legal Education (MCLE) in California, MCLE Los Angeles, CLE Orange County, Irvine & San Francisco



Google provides a chart to check the status of any of its Apps.
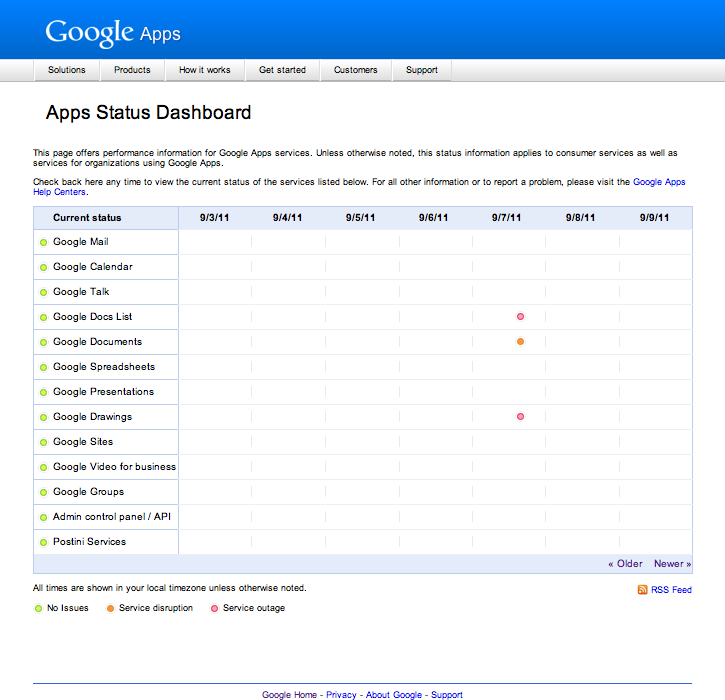
Color coded dots indicate the current status of each service.
- Green indicates "no issues."
- Yellow indicates a "service disruption."
- Red indicates a "service outage."
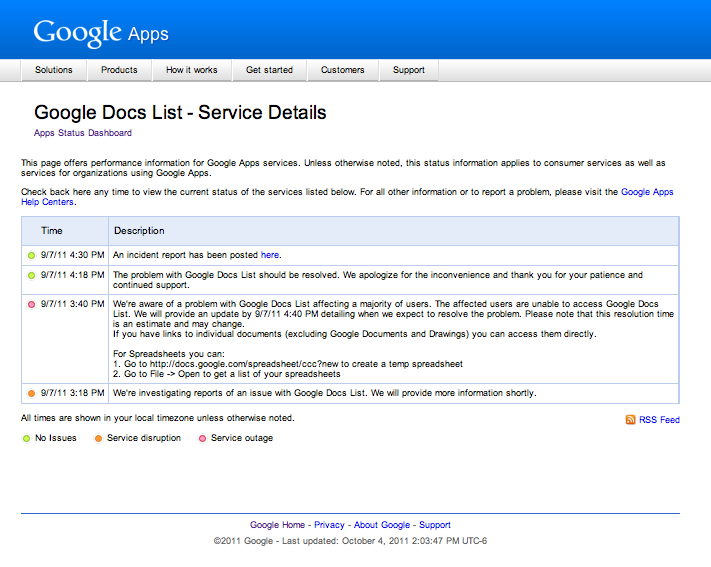
Clicking a yellow or red dot takes you to a "Service Details" page that outlines the issues surrounding the disruption or outage.
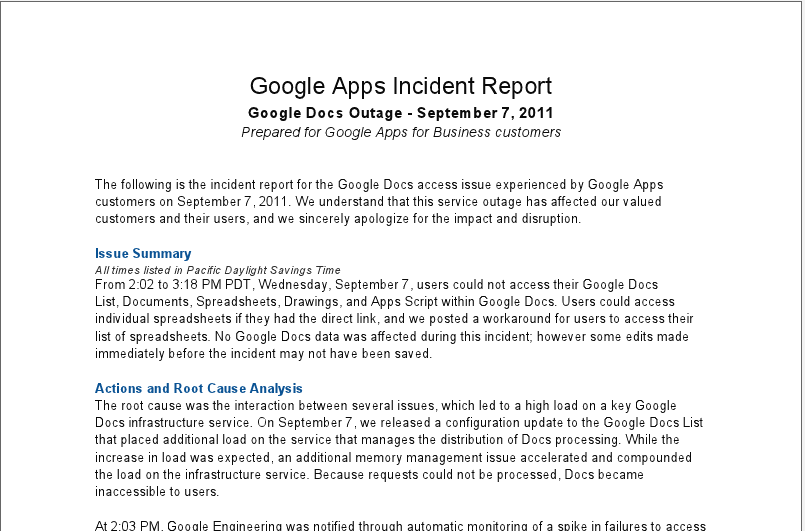
Links are also included on the "Service Details" page to "Incident Reports" containing more detailed information abaout the disruption or outage.
Apps tracked on the chart include:
- Google Mail
- Google Calendar
- Google Talk
- Google Docs List
- Google Documents
- Google Spreadsheets
- Google Presentations
- Google Drawings
- Google Sites
- Google Video for business
- Google Groups Admin control panel / API
- Postini Services